
Microclimatic sensors
All sensors are intercalibrated from -20°C to +50°C prior to being installed out in the field, in order to control for potential deviations and to check the relevance of our measurements


Mormal, Blois, Aigoual forests: HOBO sensors
Two HOBO sensors will be placed at the center of each of 180 plots, to measure air temperature (1 m above the ground) and soil temperature (8 cm below the ground). Air sensors will be attached on the North side of a tree, preferably of 10-20 cm diameter, by spring wires to adjust to tree thickness growth. They will be placed in white PVC tubes to avoid sun overheating. The 1-m height for air sensors minimizes game damage risks (especially wild boars). Similarly, soil sensors will be attached by a wire to a nearby tree to avoid losses resulting from wildlife activity.

and an explanatory note, at 1-m height above the ground (by Fabien Spicher)
Air temperature will be recorded every hour (64 Ko memory sensor), and soil temperature every two hours (8 Ko memory), as soil is a more stable environment than air. HOBO sensors battery has a one-year longevity; hence, a field session will be planned once a year to replace batteries and fetch data.


RENECOFOR network: TMS sensors
A second type of sensor will be installed throughout the RENECOFOR network: the TMS (Temperature Moisture Sensor).
This sensor, innovative and very easy to use, is designed to measure the climatic conditions experienced by a typical small herbaceous plant, at different levels:
- Its leaves (15 cm);
- Its overwintering buds (0-2 cm);
- Its roots (- 8 cm), as well as the humidity around its roots.
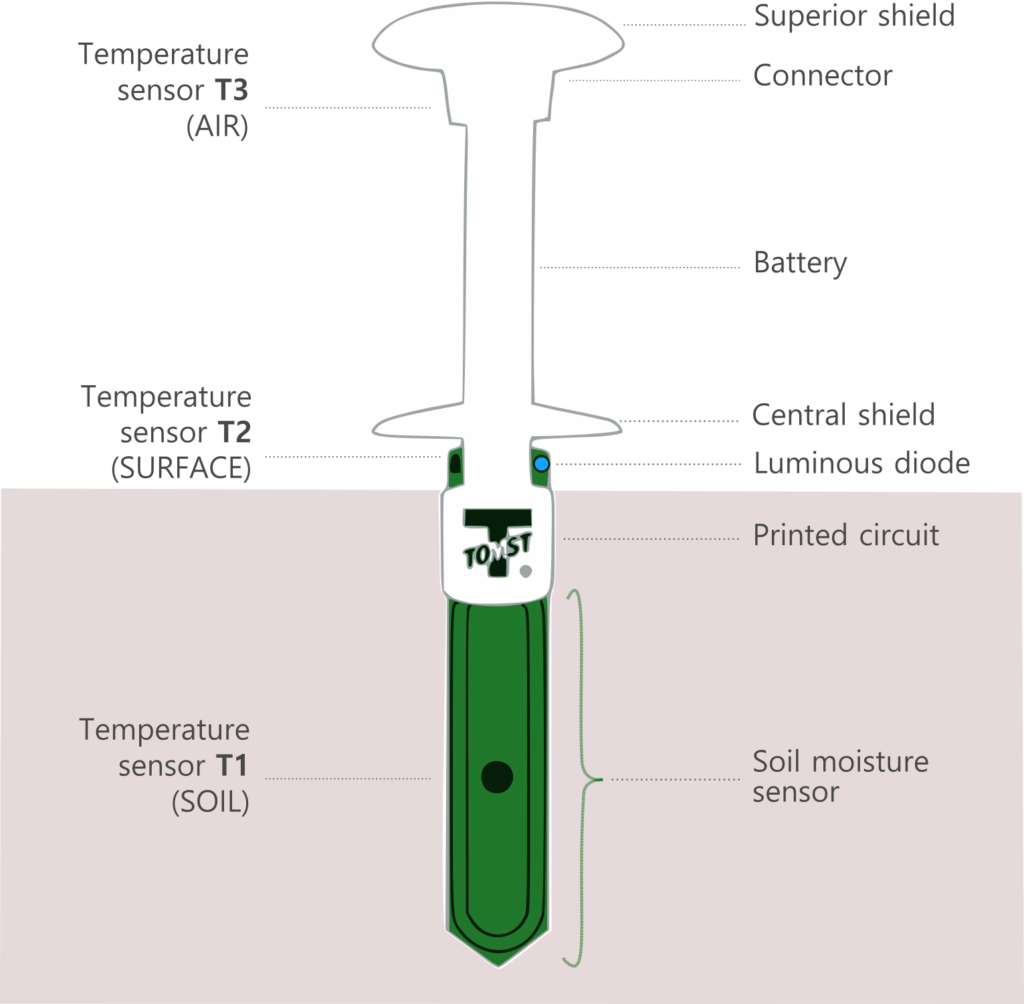
The green part is entirely buried into the ground
The temperature and humidity data are taken continuously every ¼ hour (by default) since the TMS leave the factory, and until the end of the machine’s life, without the need to program it.
The TMS has a life span of approximately 10 years, and a memory large enough to store 14 years of data, which means that it is not necessary to intervene in the field every year.
In order to measure the effect of the forest cover, TMS sensors will be installed each time both in the center of the RENECOFOR plot and in a nearby open area (in full light conditions). The installation protocol will be provided to RENECOFOR ONF agents. Data recovery will simply be done by returning the sensor by mail.
Dendrometric surveys
These inventories only concernthe 180 plots in the three forests, Mormal, Blois and Aigoual. The RENECOFOR plots are already monitored, with dendrometric and floristic surveys done at regular intervals since the 1990s.
Basal area and stand structure

The center of the plot is marked by the tree carrying the temperature sensor. Concerning the structure of the forest stand, there are two possible scenarios:
- Average diameter < 7.5 cm: inventory of all the stems on a 154 m² surface, i.e. 7 m radius (number and average diameter for each species).
- Average diameter > 7.5 cm: relascopic sampling (constant angle, basal area factor of 1 or 2 depending on stem density and average diameter). Each tree included in the inventory will be determined and its diameter measured at 1.30 m. The height of the tree carrying the sensor will be measured by a vertex, as well as that of the three largest trees. The distance from the center and azimuth of these three largest trees will be measured.
Canopy cover estimation
Canopy coverage measurements will be taken in 8 positions: first in the center of the plot, then in the four cardinal directions (North, South, East, West) around the central tree, and finally at a distance of 5 m in each cardinal direction. A double approach will allow more reliable and comparable measurements:
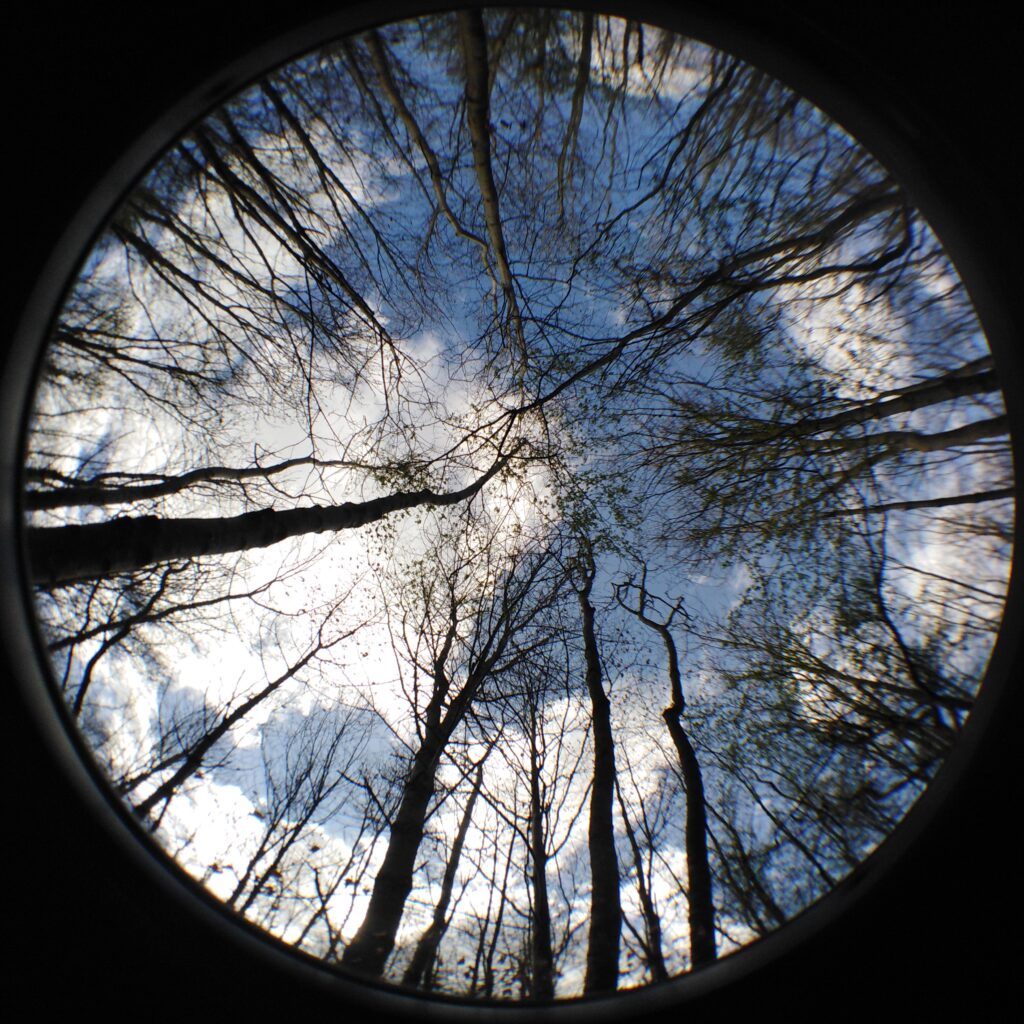
Hemispherical pictures
A Fisheye (wide angle) lens will be used to take pictures of the canopy. These photos will be taken with a smartphone, and processed (GLAMA app, GLA program…) to estimate a canopy cover index, by determining the proportion of light gaps relative to the vegetation.

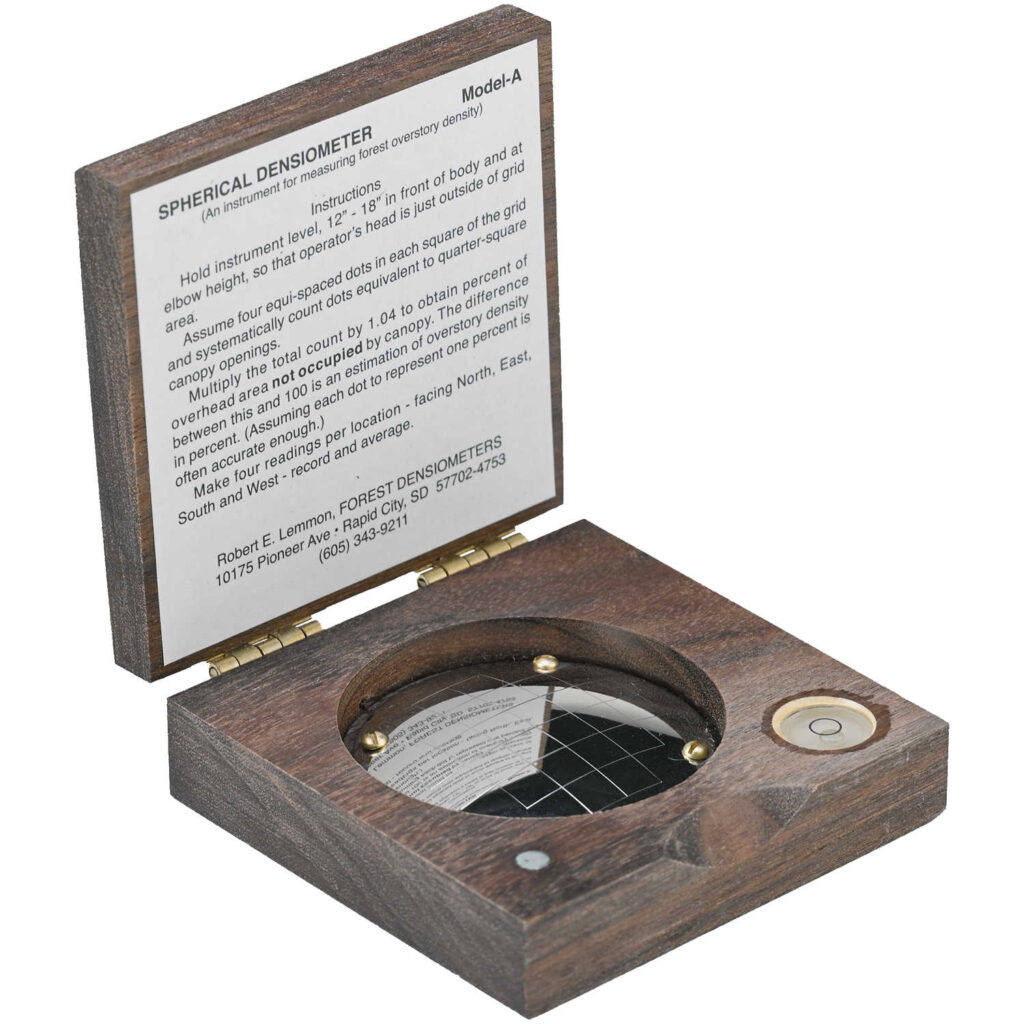
Densiometer
This device consists of a curved and squared mirror. It also gives an estimate of canopy cover, by counting in each section the number of areas showing the sky (4 points in each of the 24 squares, i.e. 96 points in total).
Flying over the three forests with airborne LiDAR
LiDAR (Light Detection And Ranging) is a technology that uses a laser beam to obtain a 3D georeferenced point cloud. A contractor will be commissioned to fly over the plots studied on each of the three forests and deliver LiDAR data with a target resolution of 50 cm to 1 m.
From the multiple points obtained in that way (about 10 points per m²), a very precise digital terrain model can be deduced, as well as a model of the vegetation surface, or digital canopy model. We can then extract variables that are particularly relevant for modelling the microclimate, such as:
– Exposure
– Slope
– Micro-relief
– Tree canopy density
– Height of the canopy
– Forest structure and stratification
– Sunshine reaching the understory
– …

NEWS!!
We just acquired a first sample of LiDAR data for the forest of Mormal!
Thanks to our cartographer Emilie, you can freely walk around the millions of 3D points below:
Floristic and faunistic surveys
Flora and arthropods are major components of forest ecosystems, as they play an important role in the functioning of biogeochemical cycles and the provision of certain ecosystem services. These two groups will be studied on the 180 plots to explore the link between microclimate and taxonomic and functional diversity.
Floristic surveys
Complete flora surveys will be carried out on 400 m² circular plots around the central temperature sensor. For each species, its level of abundance and dominance will be specified by an eight-level index: 0, r, +, 1, 2, 3, 4, or 5. The overall cover of each stratum will also be estimated: trees (above 7 m), tall shrubs (from 2 m to 7 m), low shrubs (from 50 cm to 2 m), herbaceous plants, and soil-dwelling plants (mosses and liverworts).


Ground arthropods surveys
On each plot, 3 barber-type interception pots will be placed on the ground. These traps will be filled with salt water with some detergent, a non-attractive liquid. They will be placed for 15 days, protected by an aluminum cassolette.
In order to cover as many species as possible, and knowing that communities change with the seasons, two field campaigns will be carried out: one in spring and one in early summer. For both campaigns, the traps will be set in the same place. The traps are destructive in the sense that the animals die in the traps. It is indeed necessary for the determination of arthropods, which for the most part can only be done in the laboratory.
After recovery of the pitfall traps, the trapping liquid is replaced by alcohol for long conservation. The macro-arthropods are then sorted in the lab and determined up to species whenever possible. The carabid beetles will be identified first among the soil arthropods, a skill that a member of the IMPRINT team (Vincent Le Roux) possesses. The remaining macro-arthropods will be fully preserved, with the aim to identify them in collaboration with other potential partners possessing this expertise.
